The KUDAY Web Portal is a browser-based interface that brings your machine data to life - turning raw signals into live dashboards, historical trends, and actionable reports.
Whether you're on the shop floor, in the office, or off-site, you can access real-time insights without installing software or opening firewall ports.
No more spreadsheets.
No more delayed summaries. Just accurate, up-to-date visibility across your operations.
Designed for Real Industrial Use
Responsive Design: Works on desktops, tablets, and large-floor HMI screens
Role-Based Access: Operators see only what they need; supervisors get full line views; managers access KPI summaries
Offline Buffering: Data continues to collect during network outages and syncs automatically when restored
Secure & Local-First: No cloud dependency - runs within your network unless you choose otherwise
Fast Load Times: Optimized for low bandwidth and high reliability

Find out more about our KUDAY Web Portal,
schedule a meeting with our team!
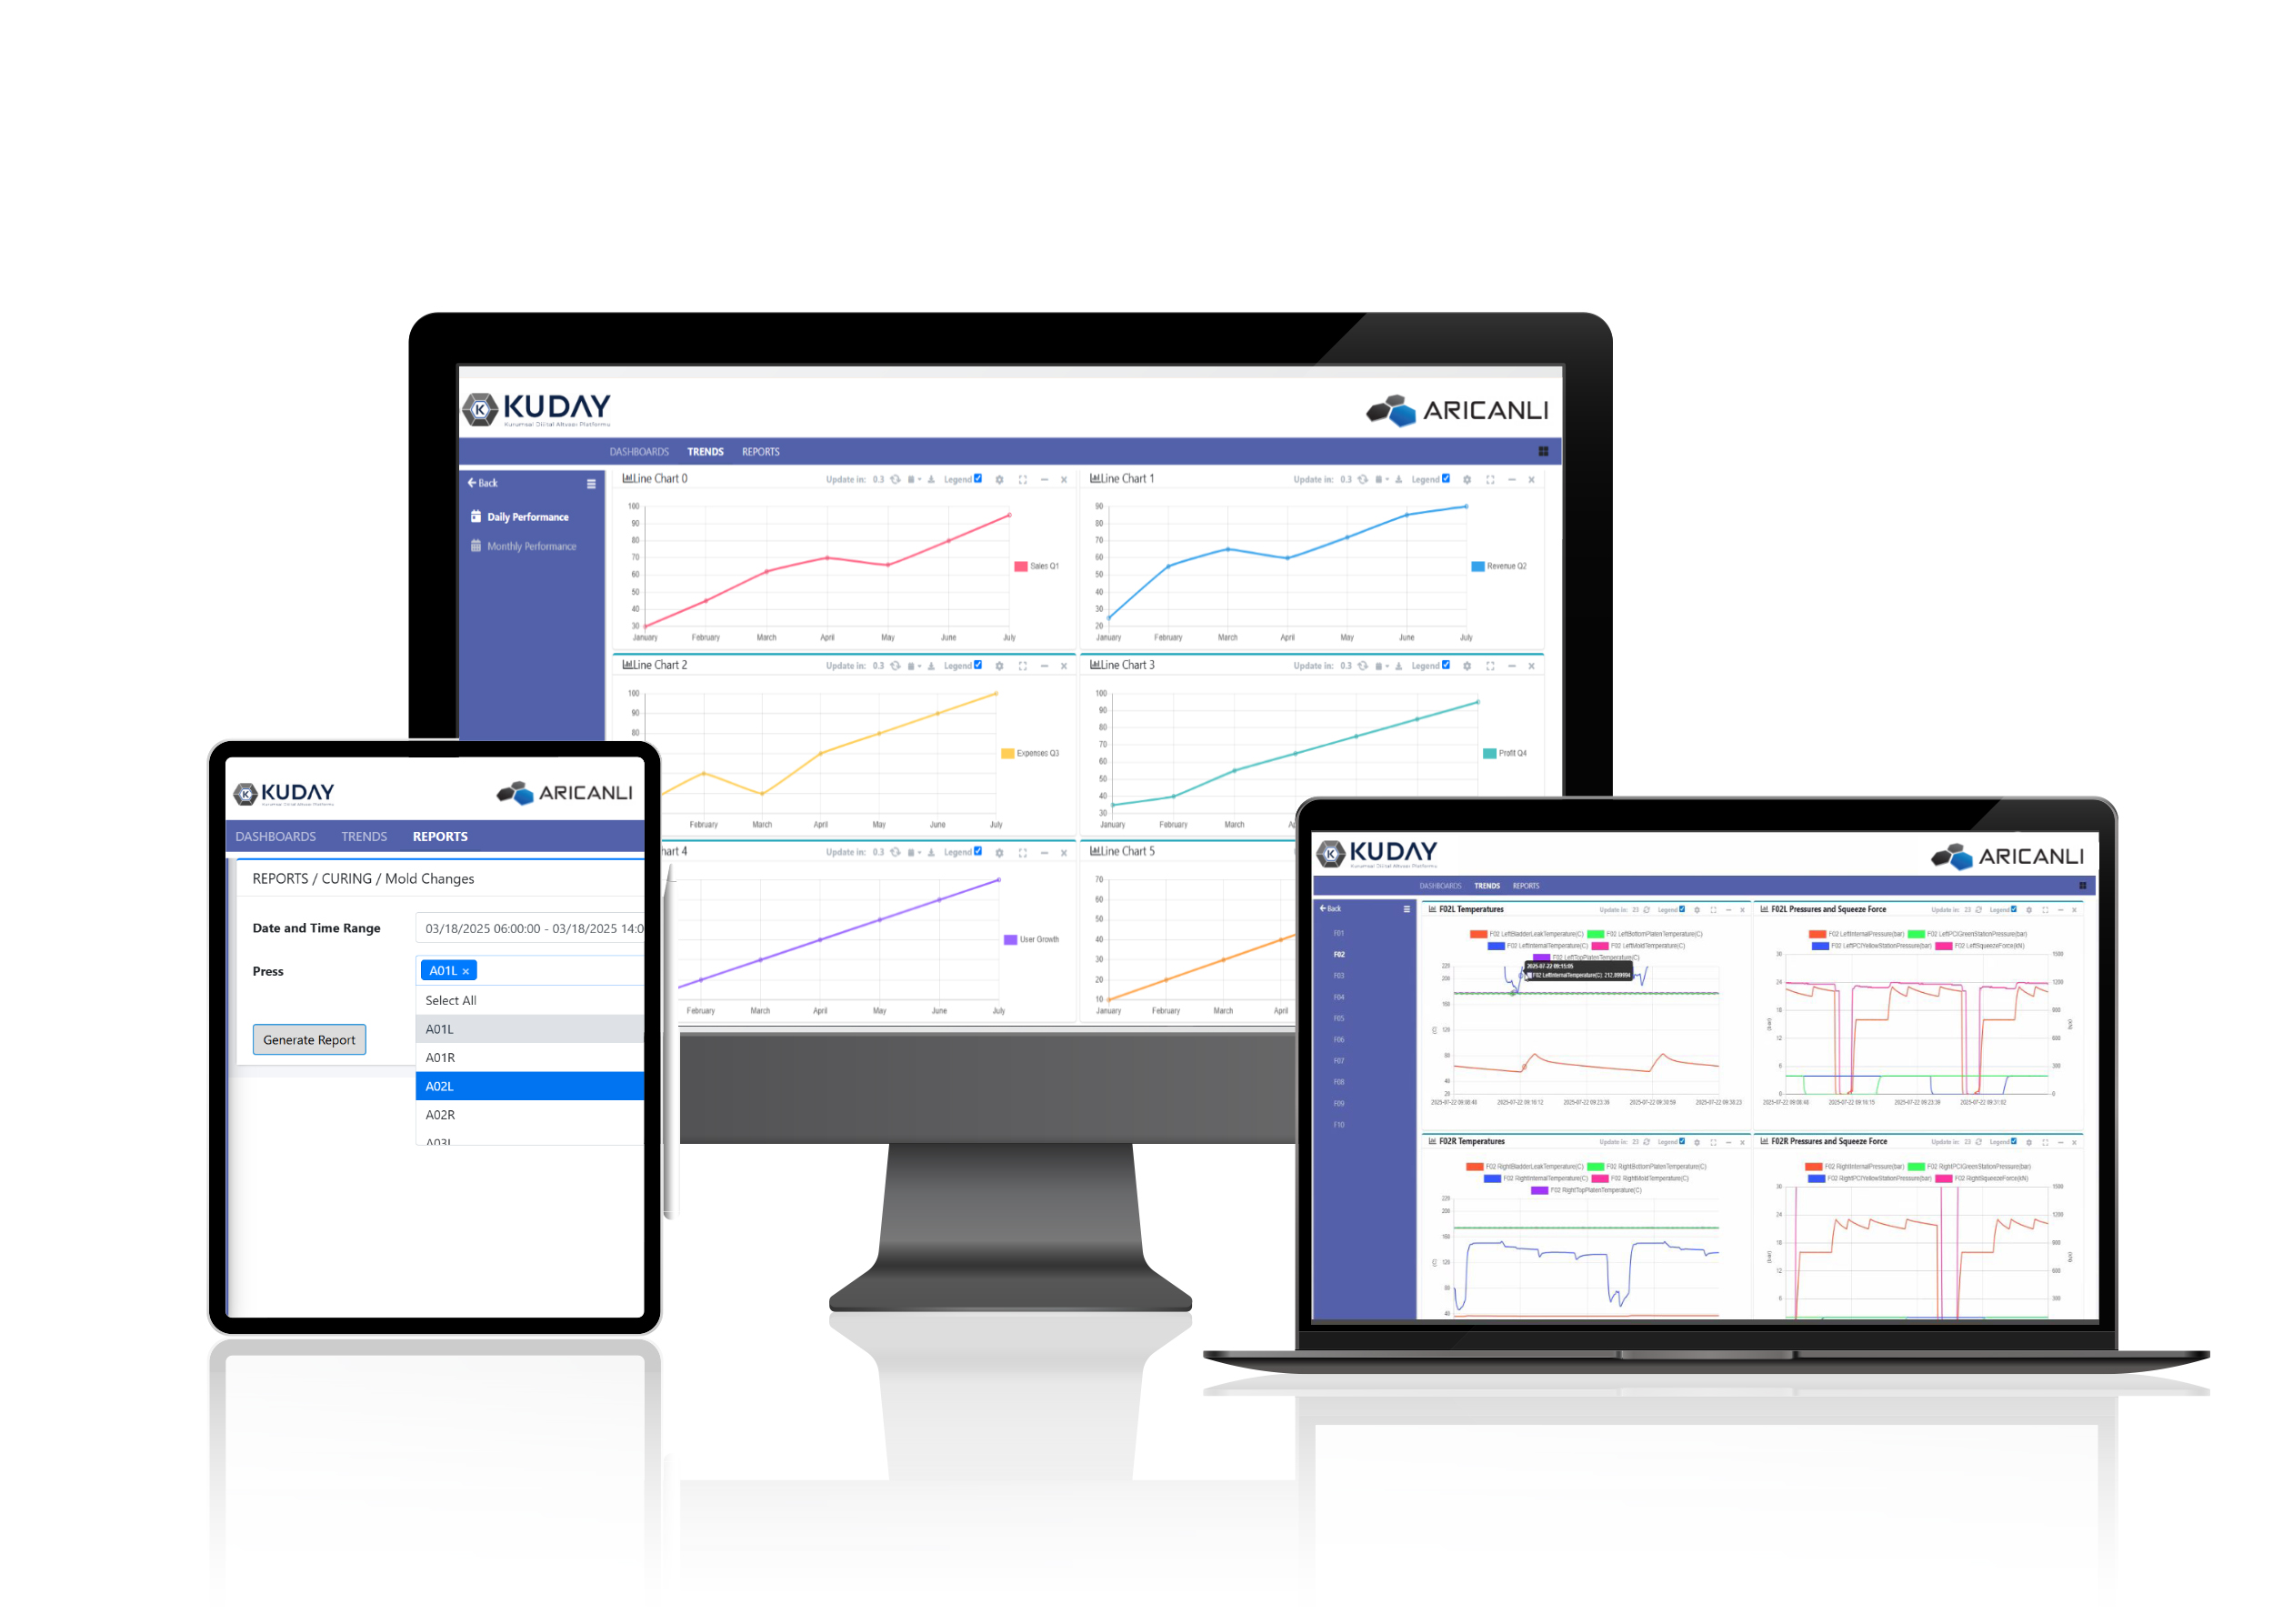
Eliminate spreadsheets and paper logs by generating structured, reliable reports directly from machine data
Whether it’s daily production summaries, shift performance, quality defect logs, or energy consumption analysis, KUDAY delivers pre-configured report templates that pull live data from PLCs, sensors, and databases. You can also customize filters, time ranges, and output formats to meet your exact needs.
All reports are fully exportable as PDF or MS Excel file format

Key Features
All reporting features are designed to turn raw machine data into structured, actionable insights — fast and without manual effort.
Understanding how your processes behave over time is key to continuous improvement
The KUDAY Web Portal’s Trending Engine gives you full control to analyze historical and live data across any variable - from temperature and pressure to downtime events or motors speed.

Key Features
Whether used for root cause analysis, preventive maintenance planning, or process optimization, the trend tool turns raw data into visual intelligence - helping teams identify patterns, validate changes, and maintain consistent performance.
Turn your data into a living, breathing view of your operation.
A dashboard should do more than look good - it should deliver the right information at the right time.
The KUDAY Web Portal’s Dashboard System enables role-specific views across your operation: shop floor, engineering, and management.
Dashboards are accessible from any device with a browser - HMI screens, tablets, office PCs - ensuring everyone stays aligned with current conditions.